One of the most stressful parts of being an on-call engineer is triaging a production incident in the middle of the night. Modern distributed systems amplify the pain with the extra cognitive overload of, well, the distributed systems: logs scattered across dozens of microservices, deeply nested trace paths, and half a dozen observability dashboards you have to correlate by hand.
Usually the setup makes total sense for the SREs who built it (maybe it’s the cost, maybe it’s whichever tool the team knows best, maybe it’s just optimizing for one particular concern), but it piles a lot of load onto whoever is on call.
So in the era of AI, it makes sense to get some help from an autonomous, smart system that’s fine-tuned for your setup and remembers all the little bits and pieces specific to your infrastructure.
This post is a complete, runnable blueprint for exactly that: an autonomous SRE agent on Google Cloud you can host next to your main stack. I’m combining two Google frameworks that solve two very different problems:
- the Agent Development Kit (ADK) for the multi-agent diagnostic reasoning, and
- the Google Antigravity SDK for the agent runtime — tool wiring, deny-by-default safety policies, and local simulation.
The whole stack runs locally with zero GCP credentials thanks to a mock-telemetry mode, so you can try it in under a minute. And everything below is verified against the code in the repo, no hand-waving.
The Core Architecture: Reasoning + Safety
A proper SRE assistant has to get two things right at the same time: reasoning orchestration (which diagnostic step happens when) and environmental safety (the agent must never be able to mutate production while it pokes around).
The blueprint splits those concerns across four small FastAPI services that talk to each other over an Agent-to-Agent (A2A) protocol, with results streamed back as Server-Sent Events (SSE).
I’m using the Antigravity SDK for the Orchestrator, the front-facing agent. It gives you solid safety gates out of the box and is smart enough to handle the user’s requests directly. Its only real capability is to delegate to the read-only SRE sub-agent, and that’s enforced by a deny-by-default policy:
safety_policies = [
    deny("*"),            # nothing is allowed by default
    allow("diagnose_sre") # …except delegating to the SRE sub-agent
]
The config above basically gates whatever tools we want to allow for the agent to use.
The actual diagnostic work is done by Google ADK agents. ADK is a code-first library for multi-agent graphs, and the SRE sub-agent runs a two-node graph:
- TraceAnalyzer scans recent trace summaries, filters for transactions that errored or breached
the latency budget (>5000 ms), and isolates the single failing
traceId. - LogCorrelator pulls the spans and the logs tagged with that
traceId, then reasons over them with a small toolbelt (metric queries, cascade analysis, post-mortem generation) to produce the root-cause report.
There’s also a third agent: an inventory agent that gives the SRE aggregated knowledge of the resources available in the GCP project. This grounds the diagnosis and keeps the agent focused on the actual resources instead of wandering around too much.
Runs anywhere, credentials optional. Every cloud dependency (
google-adk,google-antigravity,google-cloud-*,opentelemetry) is imported behind atry/except ImportErrorwith a mock fallback, and aMOCK_GCPflag swaps live API calls for local JSON fixtures. Same code path for the local simulation and the Cloud Run deployment.
Anatomy of a Diagnosis
When an alert fires, here’s what actually happens end to end, from the on-call prompt to a finished post-mortem. One thing worth calling out is the two-tier reasoning: with a real model key the full ADK graph runs; offline it falls back to a deterministic simulated workflow that produces an identically-structured report. So the demo behaves the same whether or not you have a Gemini key.
The Orchestrator does the one thing its policy allows: it hands the problem to the SRE sub-agent and steps back. From there the sub-agent streams its progress back as Server-Sent Events, so the on-call engineer watches the investigation unfold live instead of staring at a spinner.
It starts by pulling the project topology (which services exist, how they call each other, and where their databases sit) from the Inventory agent’s Firestore-backed cache. That map tells the diagnosis where to look. Then it fetches the recent traces and runs them through the two-node graph: TraceAnalyzer collapses thousands of spans down to the single failing trace worth investigating, and LogCorrelator pulls every span and log line sharing that trace’s ID to name the actual root cause. Not just “the database was slow,” but which span failed, with which error, and why.
Only then does it run the cascade analysis and draft the post-mortem, streaming the finished report back through the Orchestrator to the chat UI, where it lands as a rendered dashboard with a one-click download.
The nice thing about this setup is how extensible it is. Adding a new sub-agent or expanding an existing tool is easy with ADK and the A2A protocol, so the blueprint grows with your infrastructure instead of against it.
Deep Dive: Cascade Latency & Bottleneck Analysis
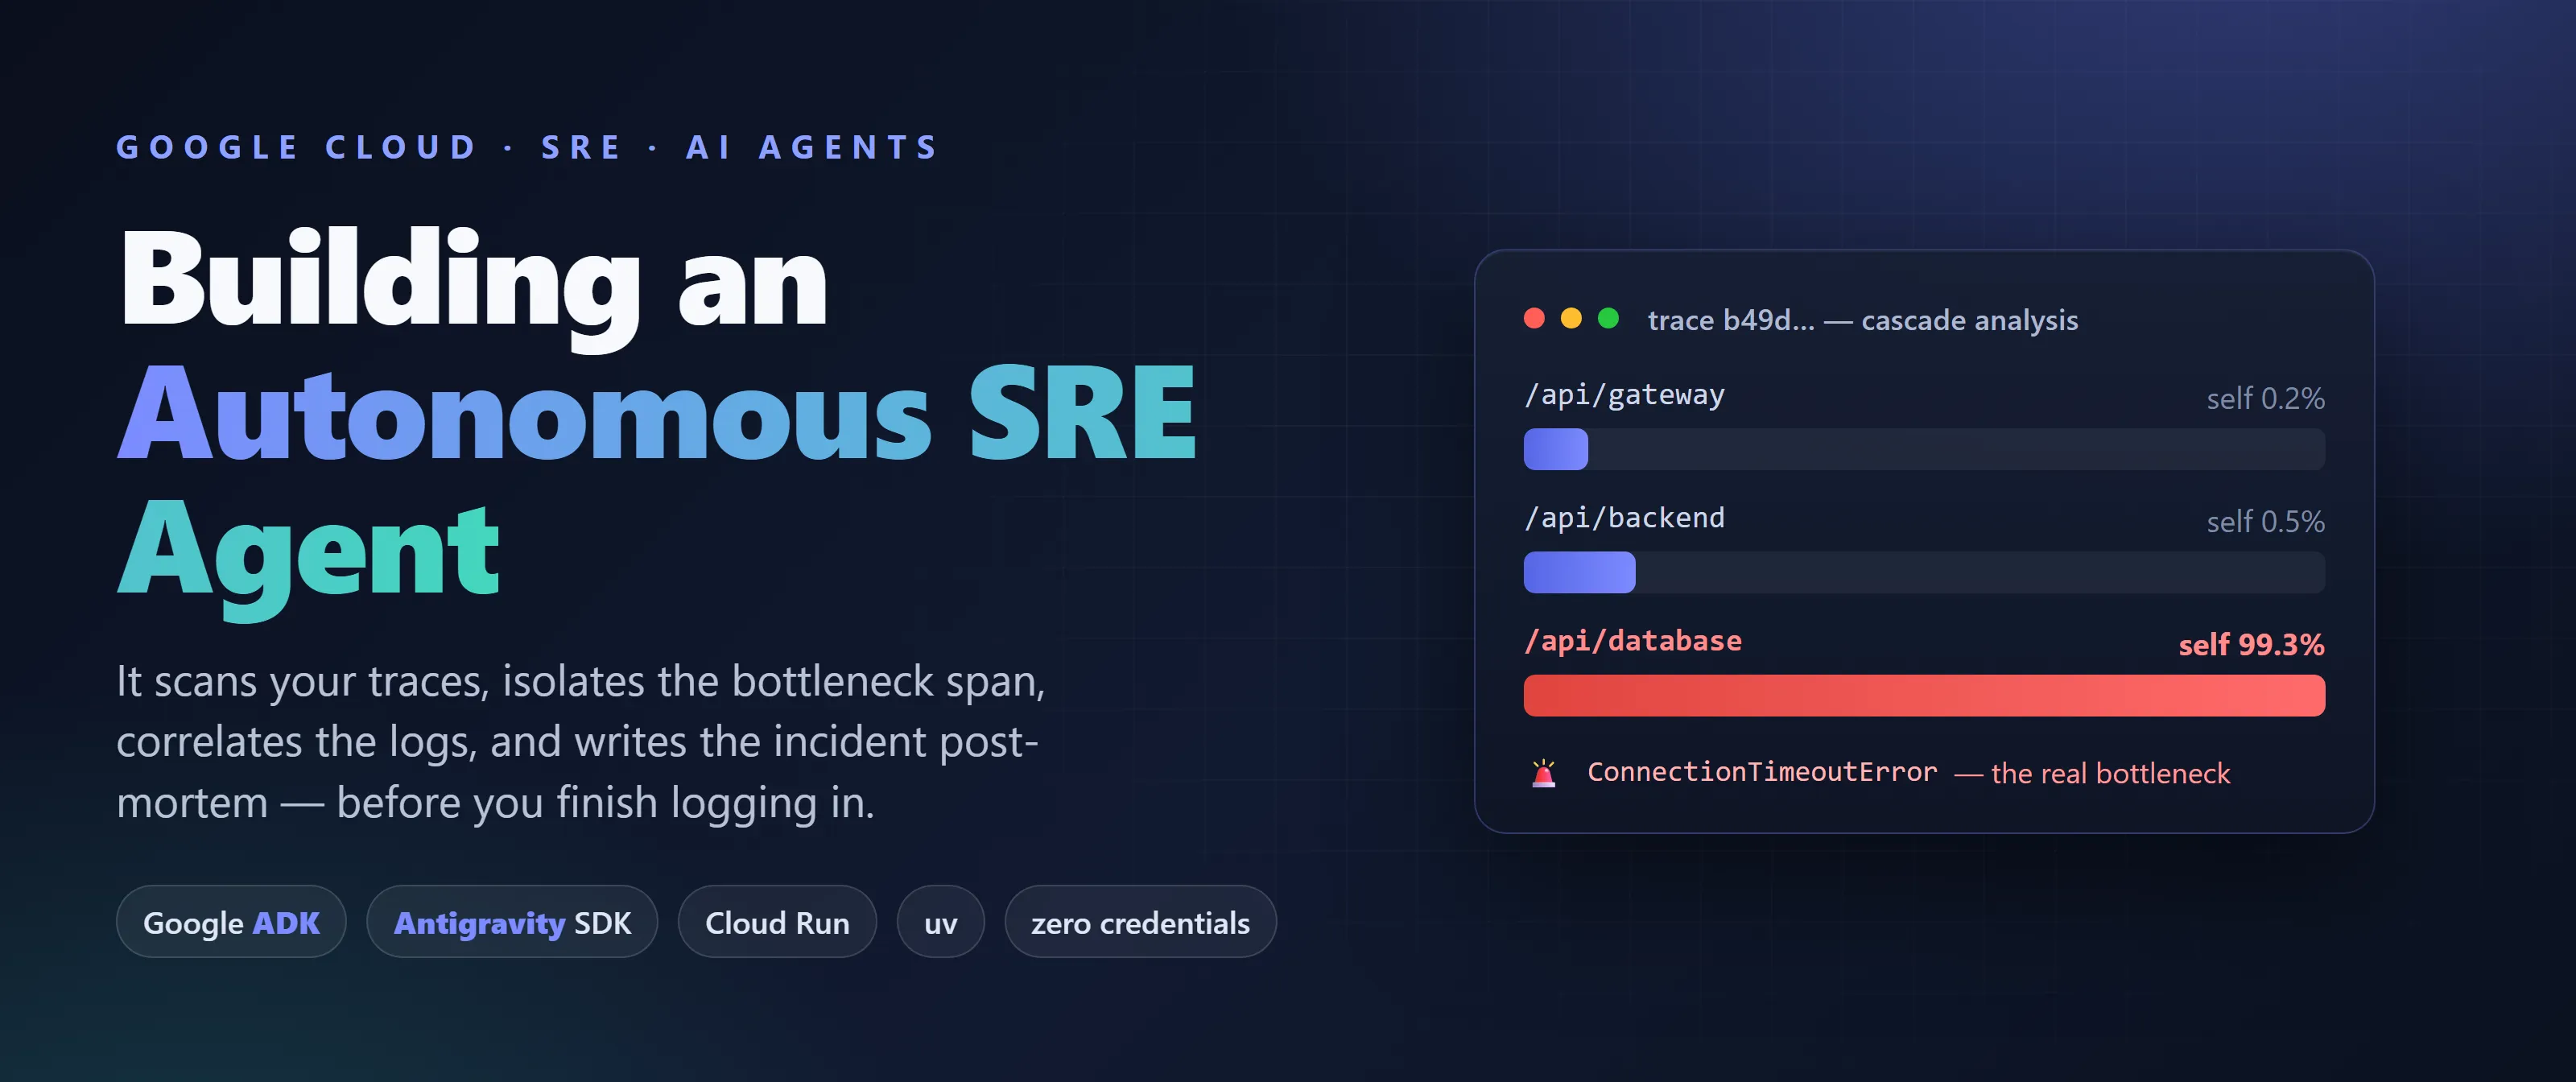
In order to showcase the agent, I have also built another FastAPI service that emulates real database errors with timeout exceptions and telemetry spans. As it is just a simulation, quite a lot of actual problems are quite similar to this one, and frequently the initial gateway/backend latency or errors are hidden downstream. But of course this is a textbook example still: a gateway request that looks 10-second-slow, but where 99% of the time is actually trapped in a database call three levels down.
The cascade-analysis tool builds the span parent/child map and computes, for every span:
-
Inclusive duration — wall-clock time of the span including its children.
-
Exclusive (self) duration — the active time spent in that span alone:
The span with the largest exclusive time is the true bottleneck. Here’s the actual, verified output
from uv run simulate_incident.py (no edits, no GCP):
### 🔍 Span Latency Breakdown
| Service / Span Name | Span ID            | Parent ID         | Status | Inclusive Time | Exclusive (Self) Time | Contribution |
| :---                | :---               | :---              | :---   | :---           | :---                  | :---         |
| /api/gateway        | span-gateway-111   | None              | ERROR  | 10270 ms       | 20 ms                 | 0.2%         |
|   └── /api/backend  | span-backend-222   | span-gateway-111  | ERROR  | 10250 ms       | 50 ms                 | 0.5%         |
|       └── /api/database | span-database-333 | span-backend-222 | ERROR | 10200 ms       | 10200 ms              | 99.3%        |

### 🚨 Identified Bottleneck
*   Bottleneck Span:     /api/database (span-database-333)
*   Self-Execution Time: 10200 ms (99.3% of total trace)
*   Status:              ERROR
*   Error Message:       ConnectionTimeoutError: Failed to connect to db-primary.gcp.internal:5432 after 10000ms
The gateway and backend both look “slow” at 10 s inclusive, but their self time is a rounding
error. The agent ignores the noise and points straight at /api/database: 99.3% of the budget,
burned in a single connection timeout.
Automated Post-Mortem & One-Click Export
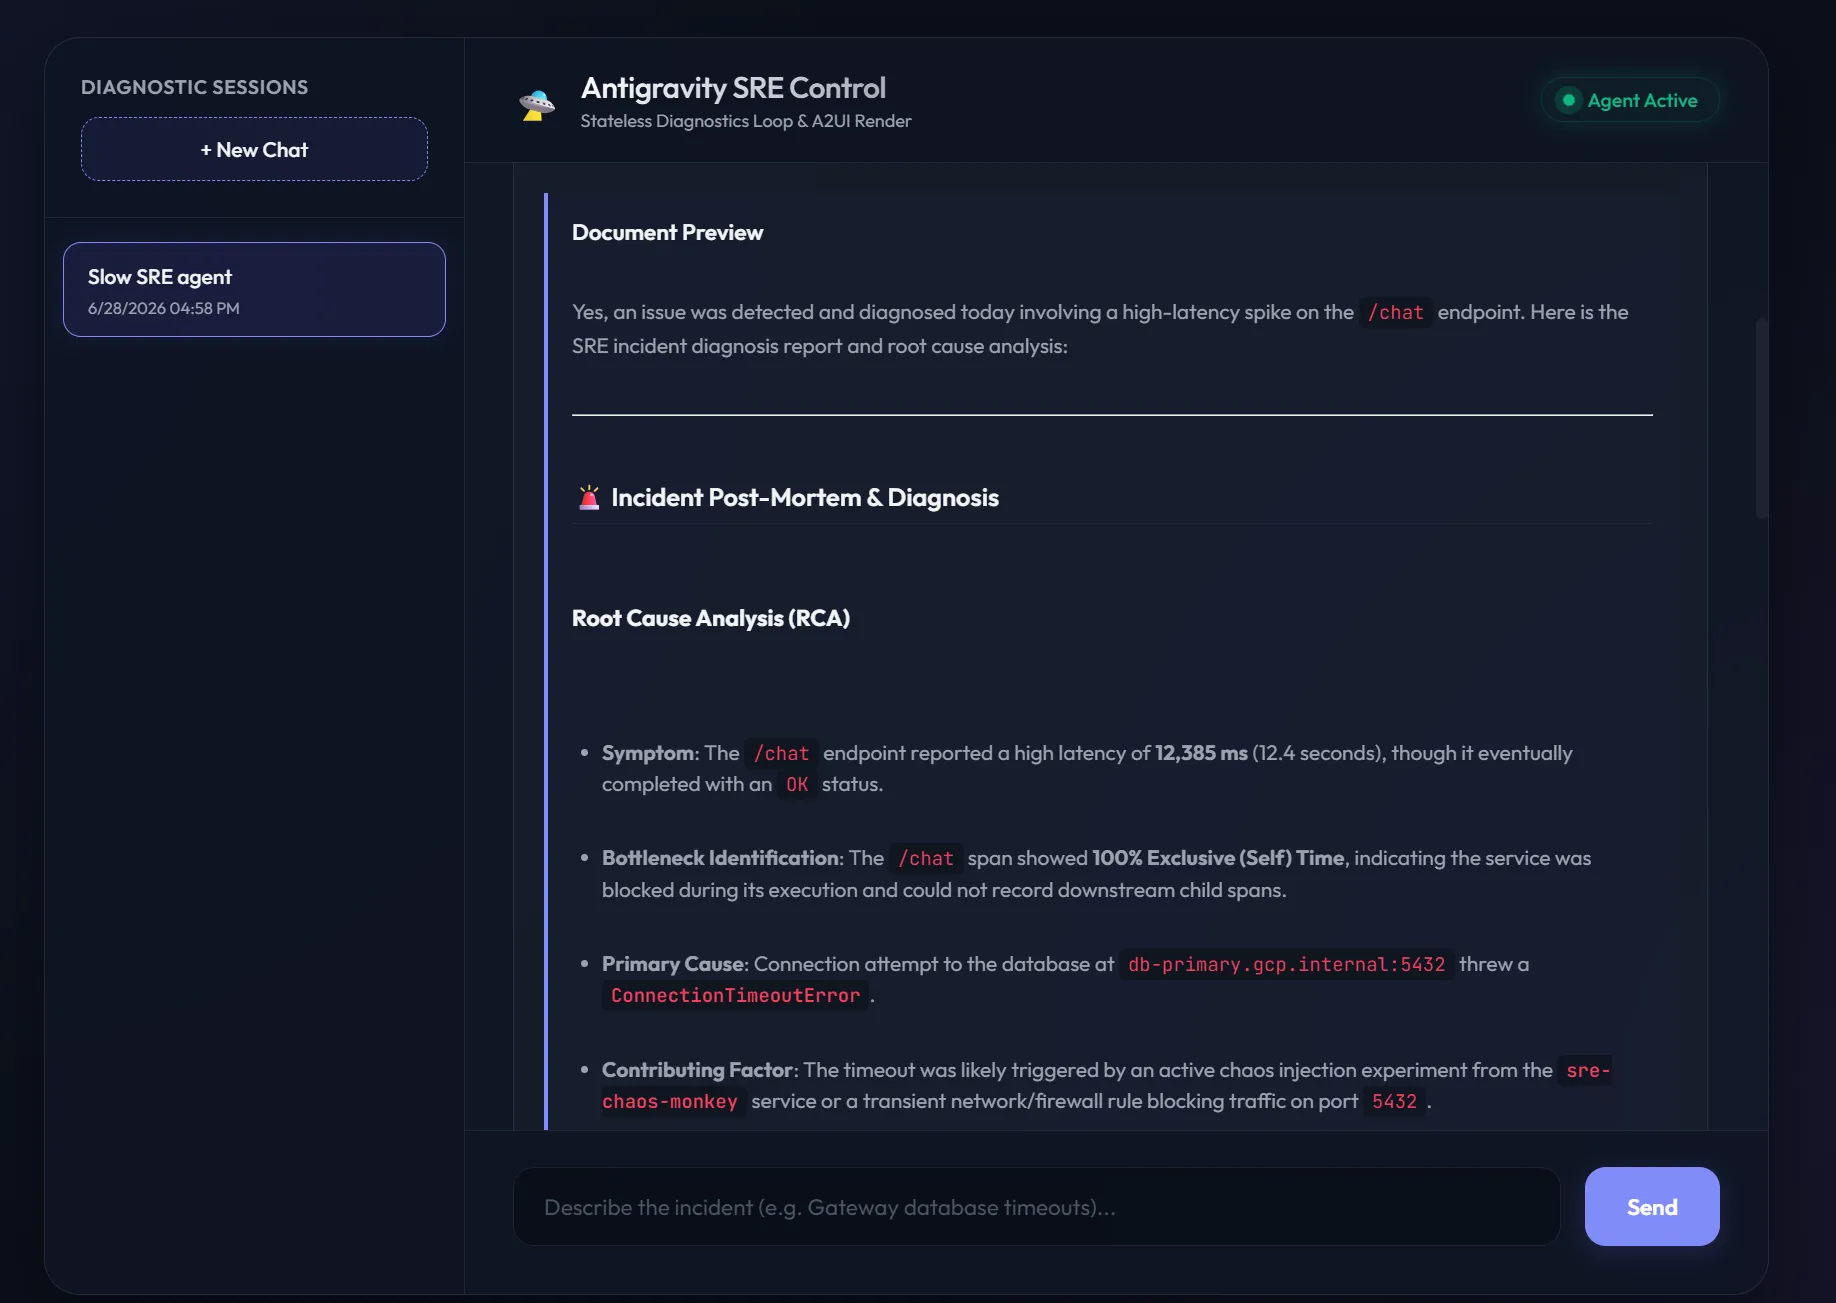
Diagnosis is only half the job. The deliverable on-call engineers actually need is a post-mortem. After the cascade analysis, a post-mortem generator drafts a complete Markdown document with an Incident Overview (time, root service, Trace ID, impact duration), a Timeline, a Root Cause Analysis, and a Prevention Plan, all populated from the real trace and log data.
That Markdown is then rendered through the A2UI protocol:
A server-side translator spots the post-mortem heading and appends a download-button component; the browser renders it as a styled button that builds the file entirely client-side (no server round-trip) from the Markdown it already holds.
One click exports post_mortem.md, ready to drop into your incident-review wiki.
And here’s how it actually looks in the deployed chat UI:
Least-Privilege IAM on Cloud Run
Handing an autonomous agent unrestricted cloud access is a non-starter. The deploy pipeline gives each Cloud Run service its own service account with the narrowest role set I could get away with:
The split is the whole point: the app that generates the chaos can only ever write telemetry,
and the agent that investigates it can only ever read. Neither can act on the other’s plane.
(The deploy also provisions an inventory-agent-sa for topology discovery and a dedicated
sre-build-sa for Cloud Build, each scoped just as tightly.)
Try It Yourself in 60 Seconds
The whole scan → correlate → analyze → post-mortem loop runs locally, with no GCP account or credentials required.
# 1. Clone the repo
git clone https://github.com/xSAVIKx/sre-agent.git
cd sre-agent

# 2. Install uv and sync the workspace (app, agent, sre_agent, inventory_agent, sre_common)
pip install uv
uv sync --all-packages

# 3. Run the incident simulation
uv run simulate_incident.py
The simulation triggers a database-timeout incident in the target app, writes mock traces and logs
to mock_telemetry_data/, boots the Orchestrator in mock mode, runs the diagnostic workflow
in-process, and prints the report to your terminal. You’ll see the structured telemetry logs (gateway
→ backend → database, ending in a CRITICAL ConnectionTimeoutError) followed by the full diagnosis:
the 99.3% /api/database bottleneck table and the complete # 🚨 Incident Post-Mortem shown
above.
Want the full multi-service experience with the web chat UI? docker-compose up --build brings up
the Orchestrator, SRE agent, Inventory agent, a Firestore emulator, and the target app together, then
you open the chat at /chat.
Project Resources
The complete, runnable source, plus a step-by-step CODELAB that builds this from scratch, lives on GitHub: